
I have three cool, quick things to share with y'all today and I hope you guys enjoy.
The first thing is this super awesome fun viz I did on the
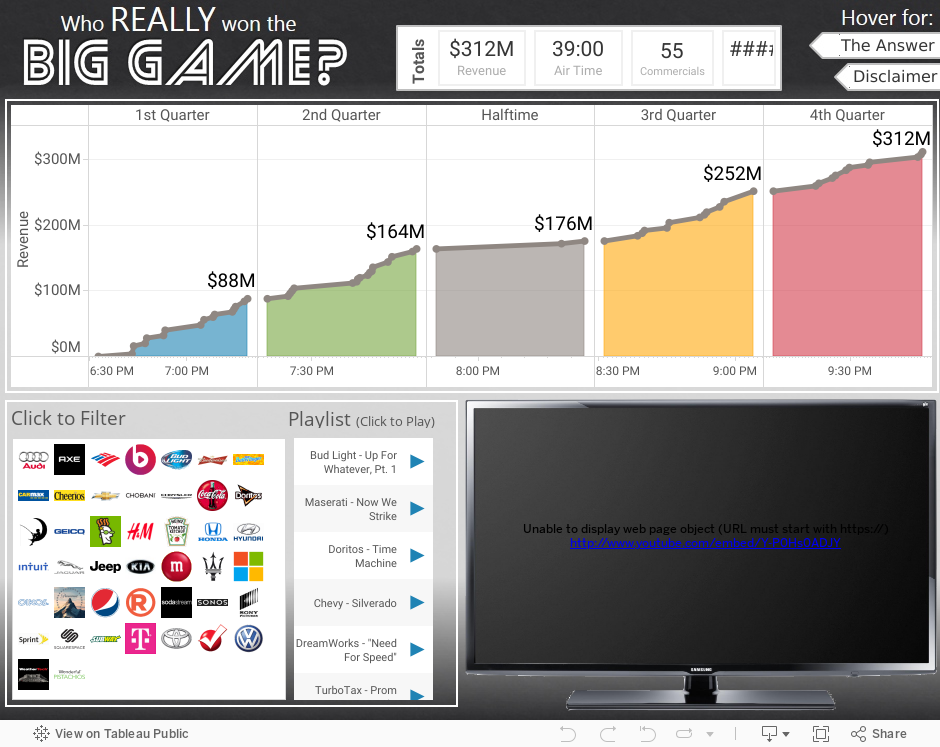
Check out the viz below!
So here's the second fun thing - how do I make something like this? This is all about how do I get an idea from my head to become a viz on the screen, and for me, I've learned a big important middle step - The Sketch.
It takes about 10 minutes, and I always do it in pencil, but it really allows you to quickly take an idea and see it. And when you can see, you can improve it (which is something I know you believe because you do data visualization).
So here's the sketch I did for this viz. It's cool to see the design work out this well in reality. If you're not currently doing a little bit of pre-viz design, you should consider giving it a shot. I've found that it actually makes the project take less total time on average, because you already have a vision of where you're heading.

The last thing (but first in my heart :) is a personal note that Baby Davis #2 was born a week and a half ago. Mama and Baby are doing great and we are incredibly blessed with how smoothly everything went.
I want to thank the Tableau Community who sent lovely congratulatory tweets from all across the world. It was really cool and I was very touched. And don't be surprised if you see a Baby Davis viz coming soon.
If you have a comment, I'd love to hear it. Thanks for checking it out!
Nelson
Congrats on the baby. I just sent this to my team with the following notes:
ReplyDelete//For all the pomp of the halftime show, it generates relatively little revenue vis a vis the rest of the game, because it's the longest stretch without a commercial--though it's generating brand recognition, it's not generating actual revenue.
I'm surprised at the steep increases in revenue generated in the later parts of the game, especially middle fourth quarter. I suppose that's a hedge on it being a good game, so for this year, those people "lost" in the sense they spent a lot for a diminishing audience. If it had been a barn burner that's a great spend.
Interesting to see what flow of game means. The fewer breaks, the more clustered the commercials get in real time, meaning what you bought maybe gets diluted by being "around" so many other ads. Compare for example, the steadiness of the third quarter commercial interruptions compared to the second quarter, in which there was a long time without a break.
Overall it makes you realize that super bowl ad spend is even more of a crap shoot than "was it a good ad" -- external forces play a big part in when it airs and how it's received and by how many people.//
Scott
Scott -
DeleteI love the analysis you provided, and you make some really great points. Buying Fourth Quarter ads really is a hedged bet on a good game. It would be interesting to see the Nielsen Ratings over the course of the game and see how varied the viewership was. Come to think of it that would make for a really great viz.... Thanks for passing it along and it sounds like you guys got some great insights from it! Many thanks!
Nelson,
DeleteFor some of the "Big Game" clunkers of the 90's and early 2000's (Ravens-Giants, Bucs-Raiders, etc.), most of us wouldn't pay attention during the game in the second half. We would go play pool, play ping pong, or get more food from the kitchen, but we would make sure to come back in time to catch the next round of commercials. It was like the poor quality of the game made the commercials more important from an overall entertainment standpoint for the evening. I'm not sure if this transcends to other families or groups of friends, but it may help counteract the people that stop watching altogether.
Love the viz.
Andrew
ABell -
DeleteVery interesting point sir, and I was actually reading some data that supports the fact that many people were doing the same thing. Even though the game was a blowout, viewership only decreased about 7% off the highs late in the second half which was surprising to me. I thought the decrease would have been much higher, but I think the reason for the limited decrease is exactly what you're taking about here - People leaving the game on, not to watch the game, but rather waiting for the commercials. The tweets certainly seem to reflect that....
Thanks man!
Great Job on the Viz of the Day!
ReplyDeleteThanks so much Amy! It's been a cool project for sure! Many thanks!
DeleteGreat Viz - interesting perspective. Thank you for sharing. And congrats on the baby!
ReplyDeleteThanks so much Ruth - lots of great things going on right now (baby included)! Thanks for posting!
DeleteThere are many kinds of the things and also there are many sort of the new and the more popular kinds of the games which are the more perfect one and the more general kinds of the games. The ben ten games is the more popular and the more awesome games.
ReplyDeleteEnpersol offers Tableau Consulting Services, specializing in implementation and dashboarding in pune and indore. also help you, whether you're just starting out with Tableau, or you need some advanced expertise.
ReplyDeleteThis comment has been removed by the author.
ReplyDeleteThank you for your post. This is excellent information. It is amazing and wonderful to visit your site.
ReplyDeleteinternships in gachibowli for it students
internship for engineering students in gachibowli
nice blog , very helpful and visit us for VISUALIZATION SERVICES in UK
ReplyDelete